Serverless statistics solution with Lambda@Edge

For a very long time I have been using Google Analytics to understand how many readers I have on my blogs. However, Google Analytics is super advanced and can do so much more than I need, you need to do proper data engineering on the data to get the full picture. I started to look into Open Source alternatives that I could host my self. Every solution use some form of client side setup for sending data, so I started thinking if I could be doing this as a server-side solution.
My blog is static HTML served from S3 and CloudFront, could Lambda@Edge be used in some way? Could I send the data I needed to a central location?
This blog explores the setup I created to create a serverless statistics service using Lambda@Edge, StepFunctions, Glue, Athena, Managed Grafana and a couple of more services.
Serverless Handbook
The solution in this post is available as a fully deployable solution on My Serverless Handbook
Architecture Overview
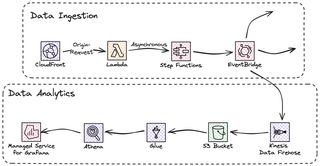
The entire architecture setup involve several serverless and managed services from AWS and creates a great foundation for analytics service. The solution ingestion and analytics parts are decoupled using EventBridge, which creates an fantastic opportunity for extending it. It's based on ingestion of data using Lambda@Edge and StepFunctions. Data store and analytics with FireHose, Glue, and Athena. Then an optional visualization using Managed Grafana.
CloudFront setup
Since I need to call other AWS services, I needed to use Lambda@Edge over CloudFront Functions. I wanted data for all page-views to be ingested, so I thought I would use the Viewer-Response integration point.

Viewer-Response would run just before the page was sent to the viewer, which would be an great integration point. However, I needed to rethink this. I use a CloudFront function in response to the Viewer-request, I use this function to re-write parts of the URL to ensure content can be loaded properly. Since I use a CloudFront function for Viewer-Request you can't use a Lambda@Edge for Viewer-Response, that combination is not supported.
Instead I opted for using the Origin-Request integration point, this will run after the CloudFront cache, jsu before the origin is called. I use a no-cache policy in my CloudFront distribution therefor this integration point will always run.
I wanted to understand what page was viewed, time of day, what country the reader is from, and what type of device the reader is using (mobile, desktop, tablet). Page is available by default in the uri field of the event. Example event
{
  "Records": [
    {
      "cf": {
        "config": {
          "distributionDomainName": "d111111abcdef8.cloudfront.net",
          "distributionId": "EDFDVBD6EXAMPLE",
          "eventType": "origin-request",
          "requestId": "4TyzHTaYWb1GX1qTfsHhEqV6HUDd_BzoBZnwfnvQc_1oF26ClkoUSEQ=="
        },
        "request": {
          "headers": {
          },
          "method": "GET",
          "origin": {
            "custom": {
            }
          },
          "querystring": "",
          "uri": "/"
        }
      }
    }
  ]
}
Country and type of device is not, but CloudFront have support for adding this, and several other headers, into the event. To do that an OriginRequestPolicy, that include the headers, must be created and added to the distribution.
HeadersEnabledOriginRequestPolicy:
  Type: AWS::CloudFront::OriginRequestPolicy
  Properties:
    OriginRequestPolicyConfig:
      Name: HeadersEnabledOriginRequestPolicy
      Comment: Headers added OriginRequestPolicy
      CookiesConfig:
        CookieBehavior: none
      QueryStringsConfig:
        QueryStringBehavior: none
      HeadersConfig:
        HeaderBehavior: whitelist
        Headers:
          - CloudFront-Viewer-Country
          - CloudFront-Viewer-Country-Name
          - CloudFront-Is-Mobile-Viewer
          - CloudFront-Is-Desktop-Viewer
          - CloudFront-Is-Tablet-Viewer

CloudFrontDistribution:
  Type: AWS::CloudFront::Distribution
  Properties:
    DefaultCacheBehavior:
    ...
    OriginRequestPolicyId: !Ref HeadersEnabledOriginRequestPolicy
  ...
Access time, is not available in the event at all, so for that data I needed to use a different trick.
Data ingestion overview
I decided early that I wanted to separate data ingestion and processing, that way I could create a decoupled solution where I could change the processing if needed. In the first solution I tried I posted an event from Lambda@Edge to an custom EventBridge event-bus.
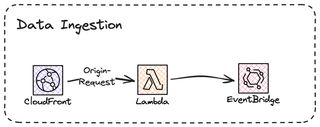
This setup worked OK, I got the data I needed and could process it. But, when I loaded a page on the blog it felt slow, it was not crazy but I could clearly feel a delay. With some tracing I discovered that posting an event cross region, which is an synchronous operation, could easily reach 200ms, enough to make the page feel sluggish.
Instead, I opted for a solution where the Lambda@Edge function invokes a StepFunction, which can be done asynchronous, and gone was the sluggish feeling. With StepFunctions I could also do more advanced operations, and since it was invoked asynchronously time was not an issue.

The first thing to resolve was the access time, it is not available in the CloudFront event, instead I need to get it from somewhere else. In the Context object for the StepFunction invocation there is a start time, this would be perfect to use as the exact time is not that important.
I could also convert the three boolean values for the viewer headers, e.g CloudFront-Is-Mobile-Viewer, I can convert this into a string field instead.
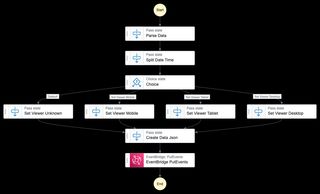
This would create an data-event that is posted to the EventBridge event-bus.
{
  "DataVersion": "2",
  "CloudFront-Is-Mobile-Viewer": "CloudFront-Is-Mobile-Viewer",
  "CloudFront-Is-Tablet-Viewer": "CloudFront-Is-Tablet-Viewer",
  "CloudFront-Is-Desktop-Viewer": "CloudFront-Is-Desktop-Viewer",
  "Cloudfront-Viewer-Country": "Cloudfront-Viewer-Country",
  "Cloudfront-Viewer-Country-Name": "Cloudfront-Viewer-Country-Name",
  "Page": "Page",
  "AccessTime": "AccessTime",
  "Userhash": "Userhash",
  "CountryCode": "Cloudfront-Viewer-Country",
  "CountryName": "Cloudfront-Viewer-Country-Name",
  "Viewer": "ParsedViewerType.Viewer",
  "UTCViewDateTime": "States.Format('{} {} UTC', ParsedTimeAndDate.Date, ParsedTimeAndDate.Time)",
  "ViewDate": "ParsedTimeAndDate.Date",
  "ViewTime": "ParsedTimeAndDate.Time"
}
Data store
As seen, Lambda@Edge will invoke a StepFunctions that will send an data-event to the EventBridge event-bus. Next would be to pick up the data-event, process and store it. As I plan to keep the solution serverless and at low cost, S3 is great data-store. To send data to S3 FireHose is a great service, as it also support buffering. Data will be stored in larger files, and data will be stored in date based partitions, which is good for Glue and Athena performance, that I plan to use.

When Firehose write data to S3 it will add several Json objects to the file, each object will be written one after another. it would be something like this.
{"DataVersion":"2",....}{"DataVersion":"2",....}{"DataVersion":"2",....}But, when Glue Crawler index the data, the crawler expect each object to be separated by a new line. This is not the default behaviour in Firehose. So to be able to accomplish a file that can be indexed, looking like this.
{"DataVersion":"2",....}
{"DataVersion":"2",....}
{"DataVersion":"2",....}
The stream must be configured with an ProcessingConfiguration that will add the delimiter. To do that a Processor of AppendDelimiterToRecord type must be added. If not, a Glue Crawler will not be able to index the data.
StatisticsDataFirehose:
  Type: AWS::KinesisFirehose::DeliveryStream
  Properties:
      ProcessingConfiguration:
        Enabled: True
        Processors:
          - Type: AppendDelimiterToRecord
Data analytics
With data stored in S3 I could point a Glue Crawler at the data and have it indexed in a Glue Data Catalog. Athena can be used to query the data and a Managed Grafana can be used for graphs and visual analytics. Now, Managed Grafana is not a fully serverless service. You will be paying a monthly cost based on the number of editors and administrators. It would be possible to leave out Managed Grafana from the solution and just use Athena for queries.
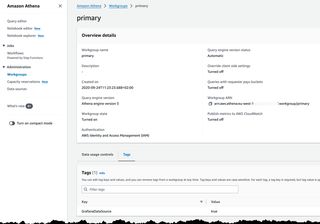
To use Athena in Grafana the first thing that needed to be done is to set a Tag on the workgroup. I was going to use the primary workgroup. The tag GrafanaDataSource must be set to true.
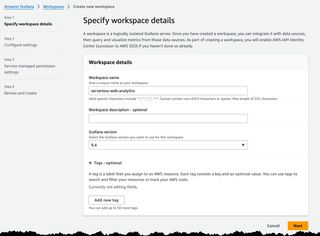
Next I could create the Managed Grafana Workspace, navigate to the Managed Grafana Console and fill in the needed information. First set a name and version to use, I'm using version 9.4 of Grafana.
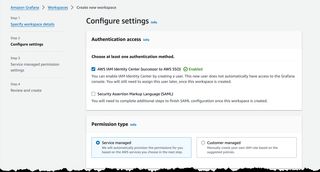
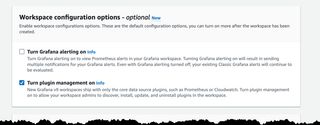
In the second step I set authentication to identity Center, make sure you tick the Turn on plugin management, this is needed to configure Athena as a source.
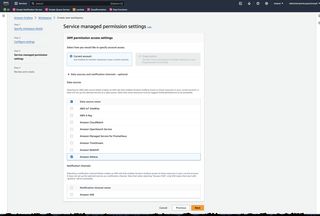
Finally add Athena as one of the Data sources.
From Managed Grafana console it's possible to jump directly into Grafana, where we can turn on Athena plugin and then configure the Athena data source.
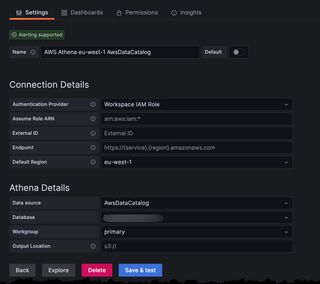
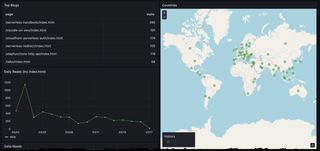
With everything created it's possible to run queries like
select  "page", count(*) as visits from statistics_data
where "viewdate" is not null and "viewdate" between $__rawTimeFrom() and $__rawTimeTo()
group by "page" order by "visits" DESC
And setup dashboards for tracking everything.
Final Words
In this post I described an approached I used to create a serverless statistics service for a static website hosted from S3 and CloudFront. For a full deployable solution, visit Serverless Handbook
Don't forget to follow me on LinkedIn and X for more content, and read rest of my Blogs
As Werner says! Now Go Build!